CASE STUDY
DividendNow: Modern Dividend Tracking Platform
Finance
Simplifying Dividend Investing: A Case Study on DividendNow’s Portfolio Intelligence Platform
DividendNow is a financial technology platform built to help dividend investors monitor, analyze, and optimize their dividend income through a single, unified mobile experience.
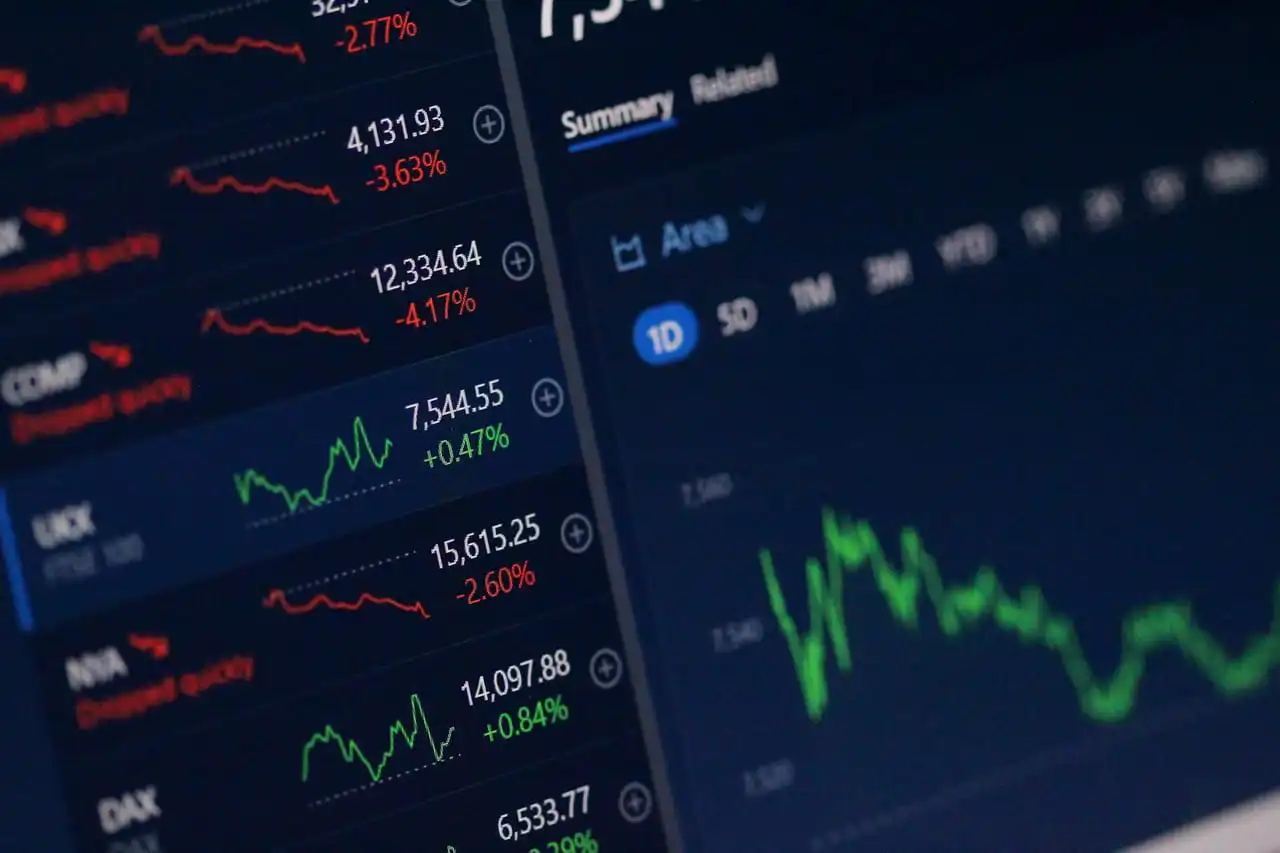
Dividend investing requires consistent tracking of dividend payments, ex-dividend dates, portfolio allocation, and income projections - tasks that are traditionally fragmented across spreadsheets and multiple financial platforms. DividendNow solves this by providing a centralized, intuitive dashboard where users can visualize their holdings, monitor income growth, and access key dividend metrics in real time.
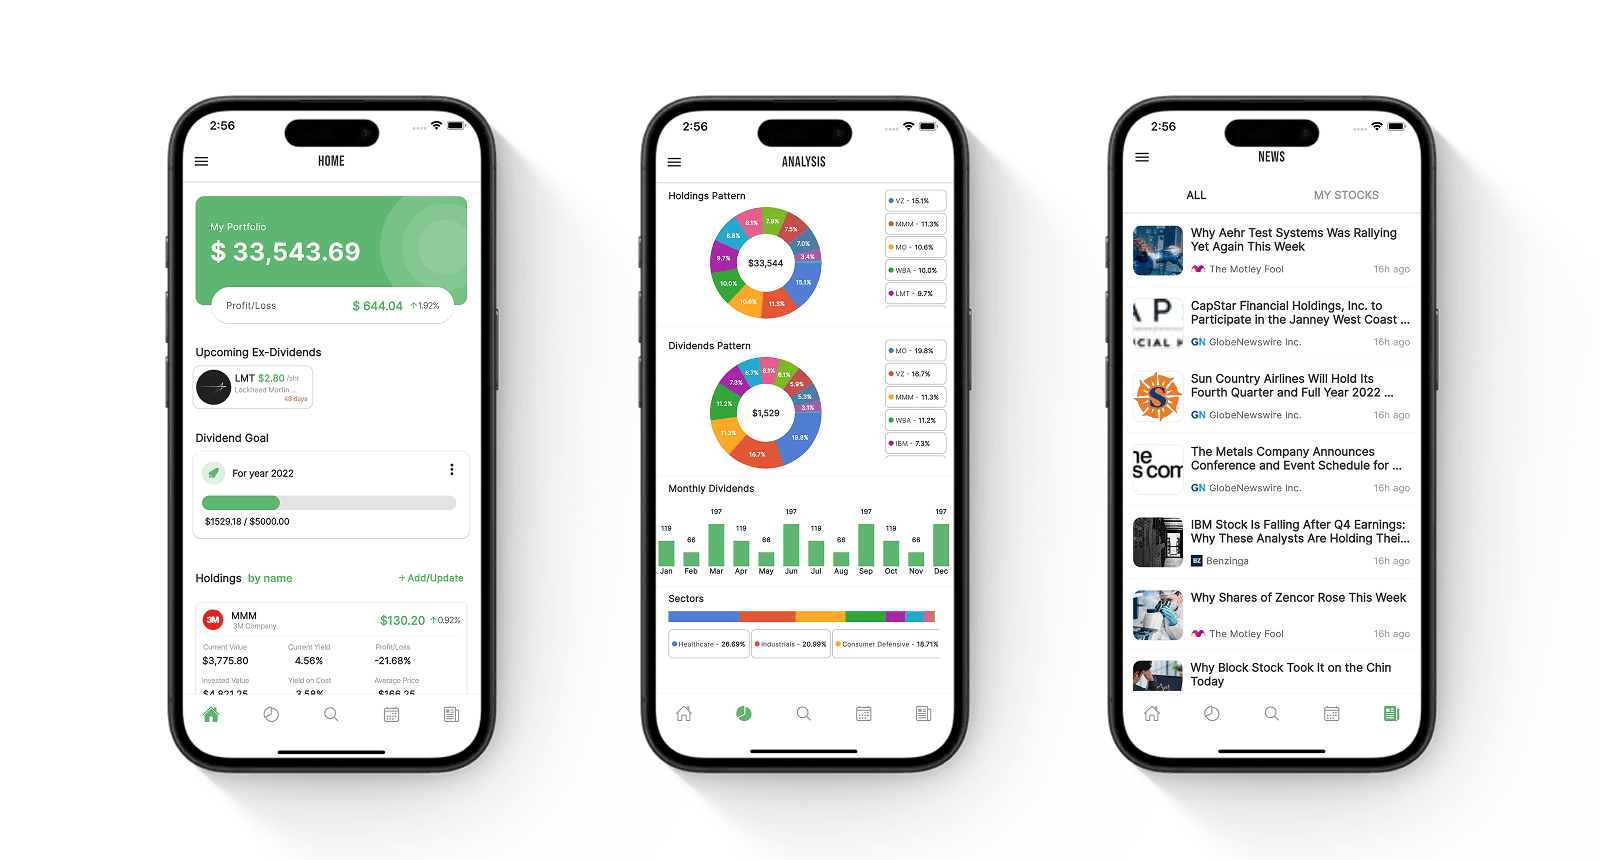
The platform enables users to track dividend income, view upcoming dividend events, analyze portfolio distribution, and set financial income goals. With advanced visualizations such as income projections, sector allocation charts, and dividend breakdowns, DividendNow empowers investors to make more informed, data-driven financial decisions.
Services Provided
UI/UX Design
Mobile App Development
App Store Optimization
Subscription Integration
Challenges
Aggregating and presenting complex financial data clearly
Dividend investing involves large volumes of financial data, including dividend histories, yields, ex-dividend dates, portfolio allocations, and income projections. Presenting this information in a way that is easy to understand without overwhelming users was a significant design and technical challenge. The platform needed to transform complex financial datasets into clear, intuitive visualizations that provide meaningful insights at a glance while maintaining accuracy and real-time responsiveness.
Delivering accurate income projections and portfolio analytics
One of the core features of DividendNow is its ability to project future dividend income based on user holdings and dividend schedules. This required implementing precise calculation systems capable of handling dividend frequency variations, yield calculations, and portfolio changes dynamically. Ensuring accuracy, reliability, and real-time updates was essential to provide users with trustworthy financial insights.
Designing intuitive financial visualizations for better decision-making
Financial analytics can often be difficult to interpret, especially for newer investors. The challenge was to design clean, visually engaging charts and dashboards that communicate portfolio performance, dividend distribution, and sector allocation clearly. The system needed to provide actionable insights while maintaining simplicity and ease of use across all experience levels.
Ensuring scalability and performance for growing user portfolios
As users add more holdings and track long-term investments, the system must efficiently handle increasing amounts of portfolio data without performance degradation. The architecture needed to support fast data retrieval, efficient calculations, and scalable growth while maintaining a smooth and responsive user experience.
Our Approach
Robust architecture for reliable financial data processing
We built a scalable and efficient backend system capable of securely managing user portfolio data and processing complex financial calculations. The architecture was designed to handle real-time updates, accurate dividend projections, and seamless data synchronization while remaining flexible for future feature expansion.
User-centric financial dashboard and visualization design
We designed a clean and intuitive interface that simplifies complex financial information into easy-to-understand visual dashboards. Using structured layouts, clear hierarchy, and meaningful charts, we enabled users to quickly understand their dividend income, portfolio allocation, and financial progress without unnecessary complexity.
Advanced portfolio analytics and income tracking system
We implemented dynamic portfolio tracking features that allow users to monitor dividend payments, view upcoming dividend events, and analyze income trends over time. The system automatically calculates key financial metrics such as yield, income projections, and portfolio distribution, providing users with actionable insights into their investments.
Optimized mobile performance and cross-platform consistency
We ensured smooth performance across both iOS and Android platforms by optimizing data loading, rendering performance, and user interactions. This resulted in fast load times, responsive charts, and a seamless experience regardless of device or portfolio size.
Impact & Results
⭐ Successfully launched a full-featured dividend tracking platform, enabling investors to monitor and visualize their dividend income from a single, unified mobile application.
📊 Delivered powerful portfolio analytics and financial visualizations, allowing users to track income projections, portfolio allocation, and dividend performance with clarity and confidence.
⚡ Enabled real-time portfolio insights and automated income calculations, eliminating the need for manual tracking and significantly improving user efficiency.
🚀 Established a scalable technical foundation for continuous feature expansion, including additional financial tools, analytics capabilities, and market integrations.